Library SARC Research Person
Edward Tufte
American statistician and political scientist; self-published The Visual Display of Quantitative Information after publishers declined it.
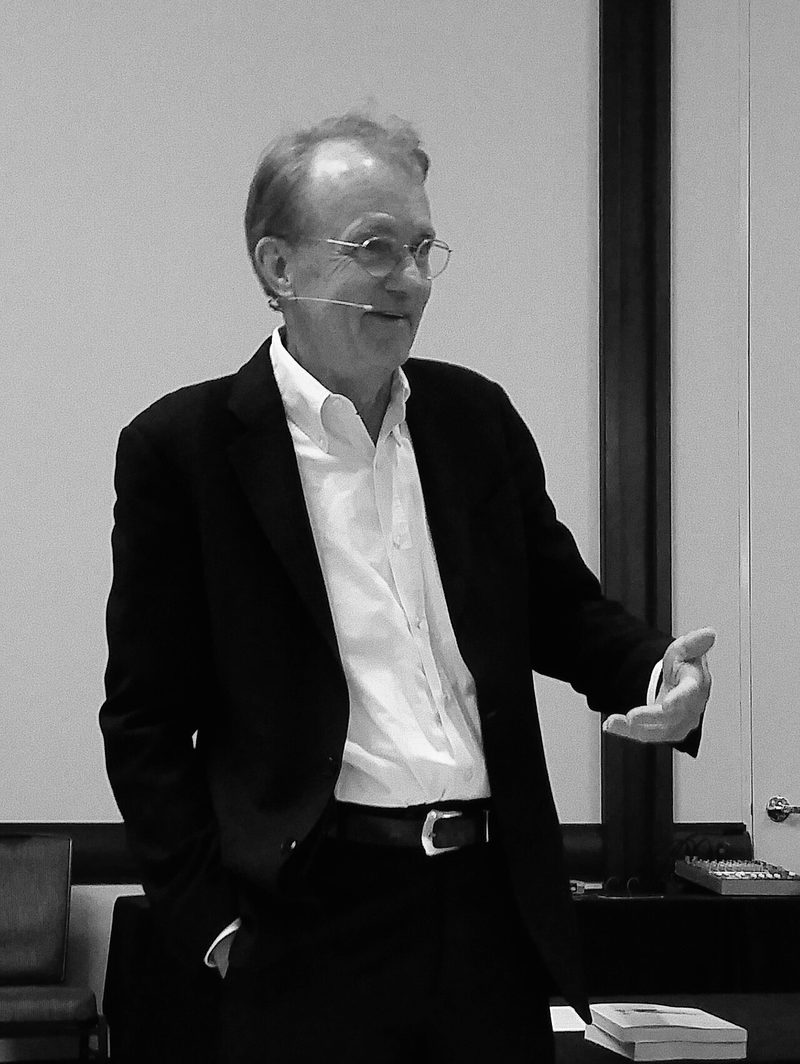
Edward Tufte (b. 1942) took a PhD in political science at Yale in 1968 after statistics degrees at Stanford, then taught statistical graphics for journalists at Princeton before joining Yale’s faculty in political science, statistics, and computer science for 22 years. When commercial publishers turned down his manuscript on principles of graphical data display, he self-published The Visual Display of Quantitative Information in 1982, financing the first printing with a second mortgage on his house — the book that established the modern vocabulary for evaluating a chart or diagram’s honesty and density of information, and made Tufte the field’s reference figure. He followed it through the same Graphics Press with Envisioning Information (1990), extending the argument from statistical charts to the wider design of maps, diagrams, and other dense two-dimensional displays.
Works in the Library
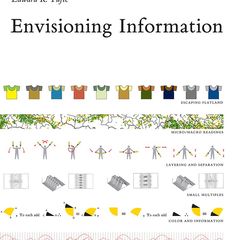
Edward Tufte BOOK 1990
Tufte's 1990 study of dense two-dimensional information design — maps, diagrams, timetables, and scientific illustration.
FORM PERCEPTION
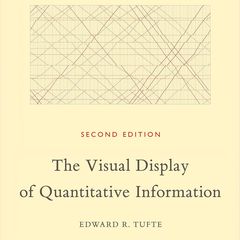
Edward Tufte BOOK 1983
The Visual Display of Quantitative Information
Tufte on the principled graphical display of data.
FORM NUMBER PERCEPTION